Stock market in pictures
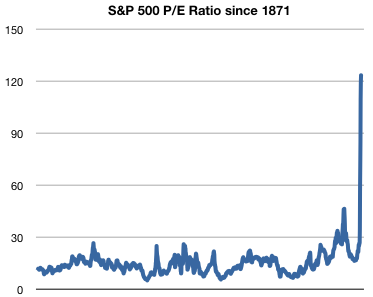
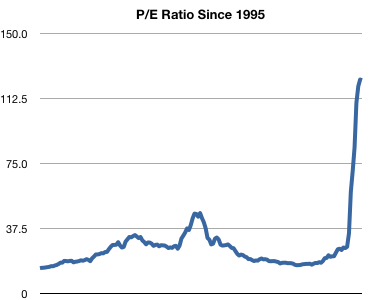
If this doesn’t alarm you, then nothing will. Why? Because P/E ratio is a simple and more or less proven predictor of long-term stock market returns. Lower is better. When P/E is 10 times greater than the 138-year average, and 3 times its previous all-time peak, when interest rates are already zero, we are in totally uncharted waters.
The one bright note for stock market investors is that the S&P500 is a weighted index. The financial sector contributed a big chunk of the overall index profits, and most of that went away. So one interpretation of these graphs is that certain ultra-large-cap stocks are fantastically overpriced, even as many smaller value stocks are still fairly priced.
At minimum, this appears to argue strongly against holding a traditional S&P index fund. One may do significantly better by owning a low-PE index fund like Vanguard Small-Cap Value Index (VISVX).
(Data source: Yale economist Robert Schiller’s data series. Monthly earnings are interpolated from quarterly. Data set comprises the S&P 500, and an equivalent broad index prior to 1957. The idea for these graphs came from similar ones posted at Jesse’s Cafe Americain, though he was making a different point I don’t necessarily agree with.)
—
